Share LaTeXで数学の図形・グラフを作成
オンラインでTeXスクリプトを編集、コンパイルできるサービスShareLaTeXを使って簡単なグラフと図形を書いてみた。
目次
Shared LaTeXの使い方
Shared LaTeXは無料と有料のプランがあり、無料プランは個人利用のみで有料プランでは複数人で共同作業、来歴管理、GitHub連携の機能が使用可能となるようだ。メールアドレスとパスワードを登録するばすぐに使えるようになる。
登録画面

作業画面
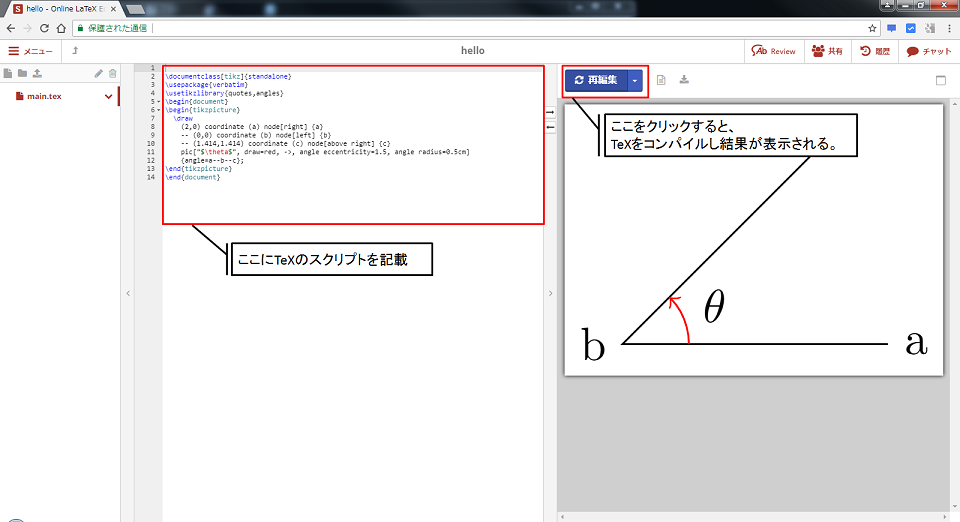
サンプル
二次関数
\documentclass{standalone}
\usepackage{tikz}
\begin{document}
\begin{tikzpicture}[scale=1.25]
    \draw[red,thick,->] (-1,1) parabola bend (0,0) (2.1,4.41)
        node[below right] {$y=x^2$};

    \draw[->] (-0.2,0) -- (4.25,0) node[right] {$x$};
    \draw[->] (0,-0.25) -- (0,4.25) node[above] {$y$};
\end{tikzpicture}
\end{document}
単位円
\documentclass[landscape]{standalone}
\usepackage{tikz}
\begin{document}
    \begin{tikzpicture}[scale=5.0,cap=round,>=latex]
        % draw the coordinates
        \draw[->] (-1.5cm,0cm) -- (1.5cm,0cm) node[above,fill=white] {$x$};
        \draw[->] (0cm,-1.5cm) -- (0cm,1.5cm) node[right,fill=white] {$y$};

        % draw the unit circle
        \draw[thick] (0cm,0cm) circle(1cm);

        % draw the horizontal and vertical coordinates
        % the placement is better this way
        \draw (-1.2cm,0cm) node[below=1pt] {$(-1,0)$}
              (1.2cm,0cm)  node[above=1pt] {$(1,0)$}
              (0cm,-1.1cm) node[left=1pt] {$(0,-1)$}
              (0cm,1.1cm)  node[right=1pt] {$(0,1)$};
    \end{tikzpicture}
\end{document}
点の回転
\documentclass[tikz]{standalone}
\usepackage{verbatim}
\usetikzlibrary{quotes,angles}
\begin{document}
\begin{tikzpicture}
  \draw
    (2,0) coordinate (a) node[right] {a}
    -- (0,0) coordinate (b) node[left] {b}
    -- (1.414,1.414) coordinate (c) node[above right] {c}
    pic["$\theta$", draw=red, ->, angle eccentricity=1.5, angle radius=0.5cm]
    {angle=a--b--c};
\end{tikzpicture}
\end{document}
参考
下記サイトは美しい図のサンプルが沢山ありとても参考になる。

コメント